Connected data
Bring together accounting, banking, payroll, sales, inventory and other approved sources.

A connected finance intelligence and advisory ecosystem that brings critical business signals into one decision-ready view—then combines automated monitoring with experienced CFO judgement.
30-day free trial available for new clients.
Leaders need trusted data, forward-looking insight and the judgement to act. The Dashboard is designed to shorten the distance between signal, interpretation and decision.
The CFO HQ combines technology, finance discipline and commercial context—supporting faster insight without removing human accountability.
Start with the concise overview, then explore the fuller platform walkthrough.
A concise introduction to connected insight, visibility and decision support.
See live KPI monitoring, trend views, budgeting, forecasting and decision-ready analysis.
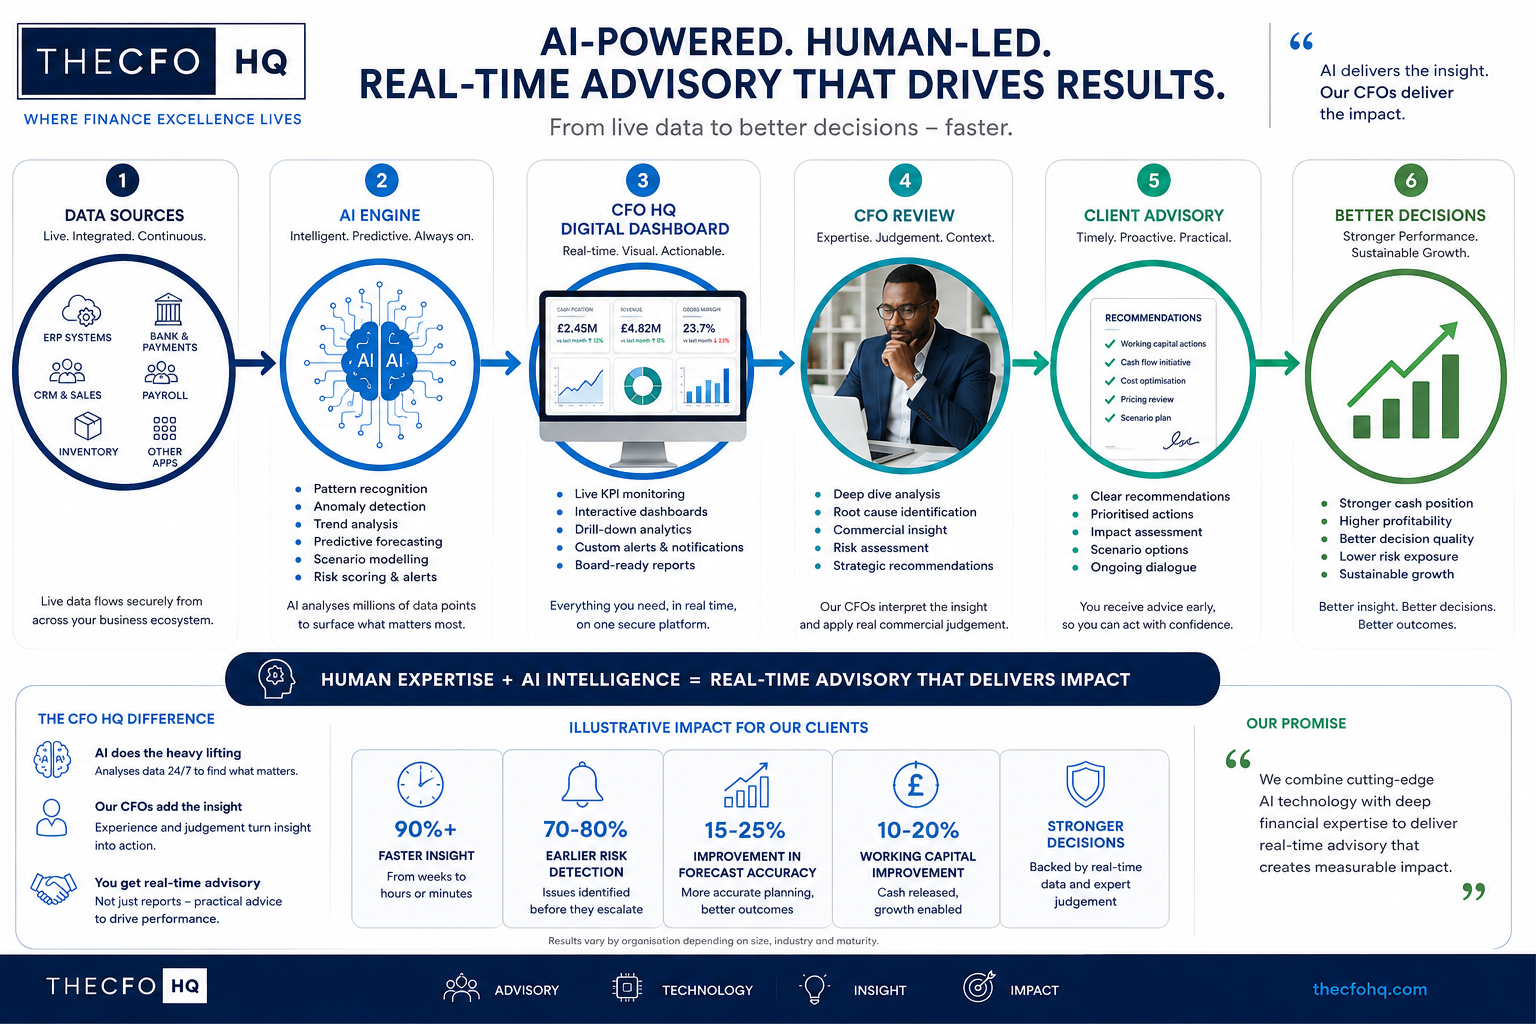
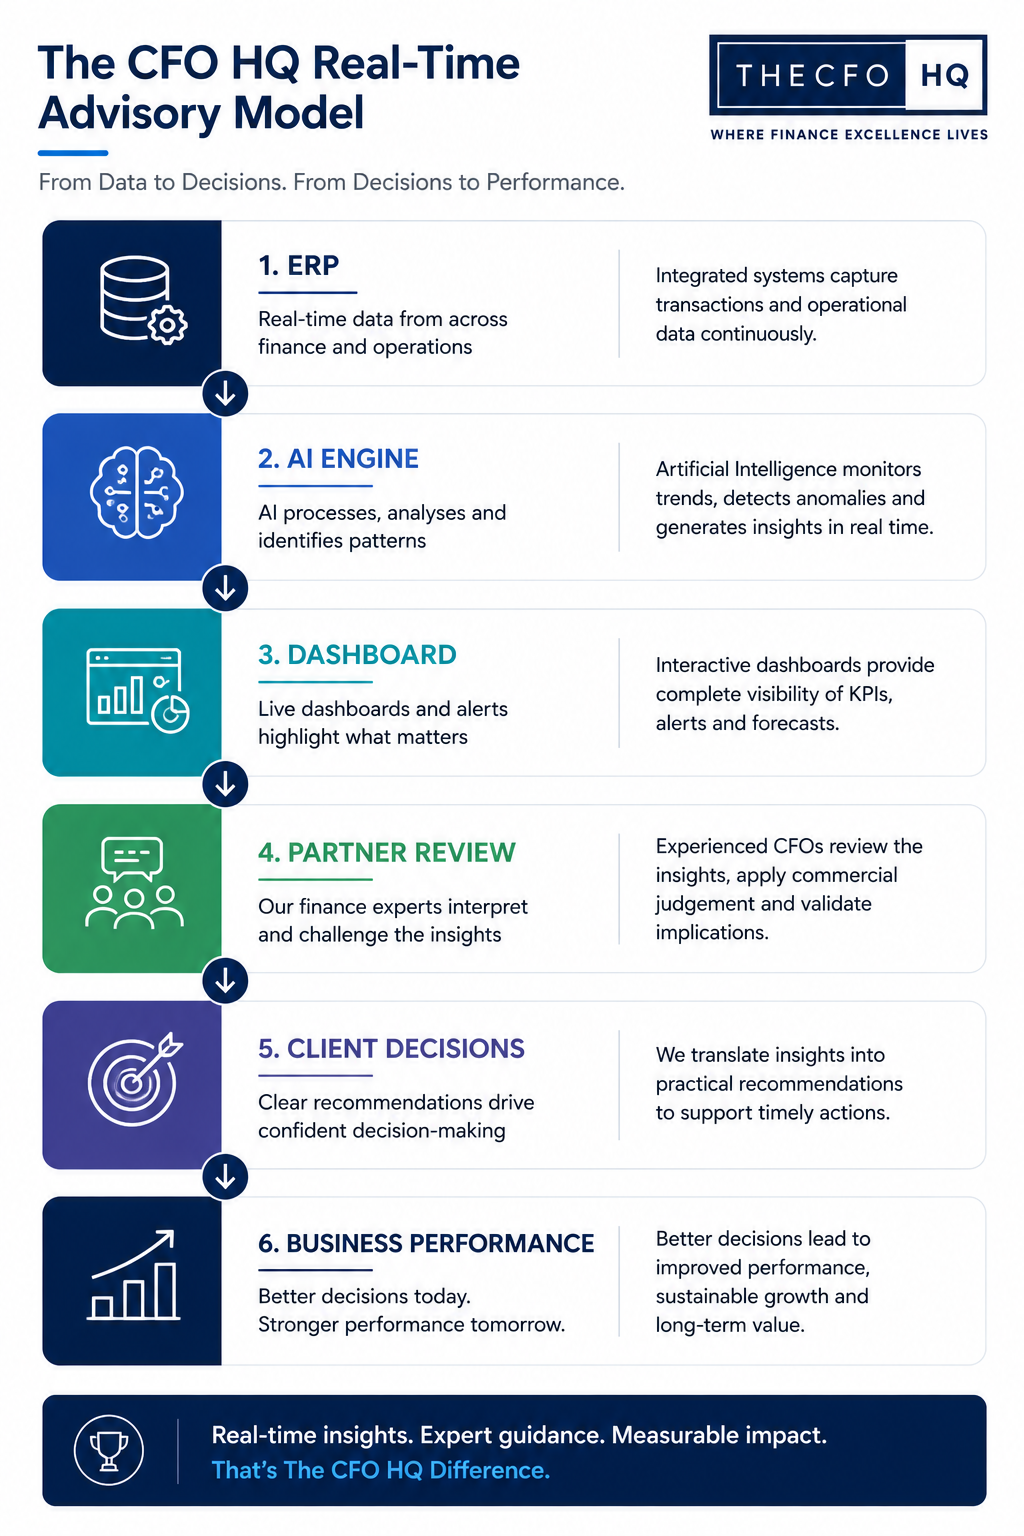
The Dashboard is not simply a reporting screen. It is the central decision layer in a broader Real-Time Advisory model.
Bring together accounting, banking, payroll, sales, inventory and other approved sources.
Scan trends, movements, thresholds and exceptions across the business.
Present live KPIs, drill-down analysis, forecasts, alerts and scenario views.
Interpret the signals, challenge assumptions and apply commercial judgement.
Translate insight into prioritised recommendations, options and actions.
Support performance, resilience, cash discipline and sustainable growth.
| Finance activity | Traditional approach | The CFO HQ Dashboard approach |
|---|---|---|
| Performance visibility | Periodic or month-end reporting | Near-real-time KPI monitoring and exception views |
| Analysis | Spreadsheet-led, manually assembled | Connected, interactive and drillable analysis |
| Forecasting | Periodic forecast cycles | More frequent rolling forecasts and scenarios |
| Risk response | Issues identified after variance emerges | Alerts and anomaly signals support earlier intervention |
| Decision support | Historic commentary | Forward-looking options reviewed by experienced CFOs |
| Board dialogue | Static packs and retrospective explanation | Decision-ready narrative, trends and scenario implications |
Configuration is tailored to sector, operating model, maturity and data availability. Start with priority questions, then expand as value is demonstrated.
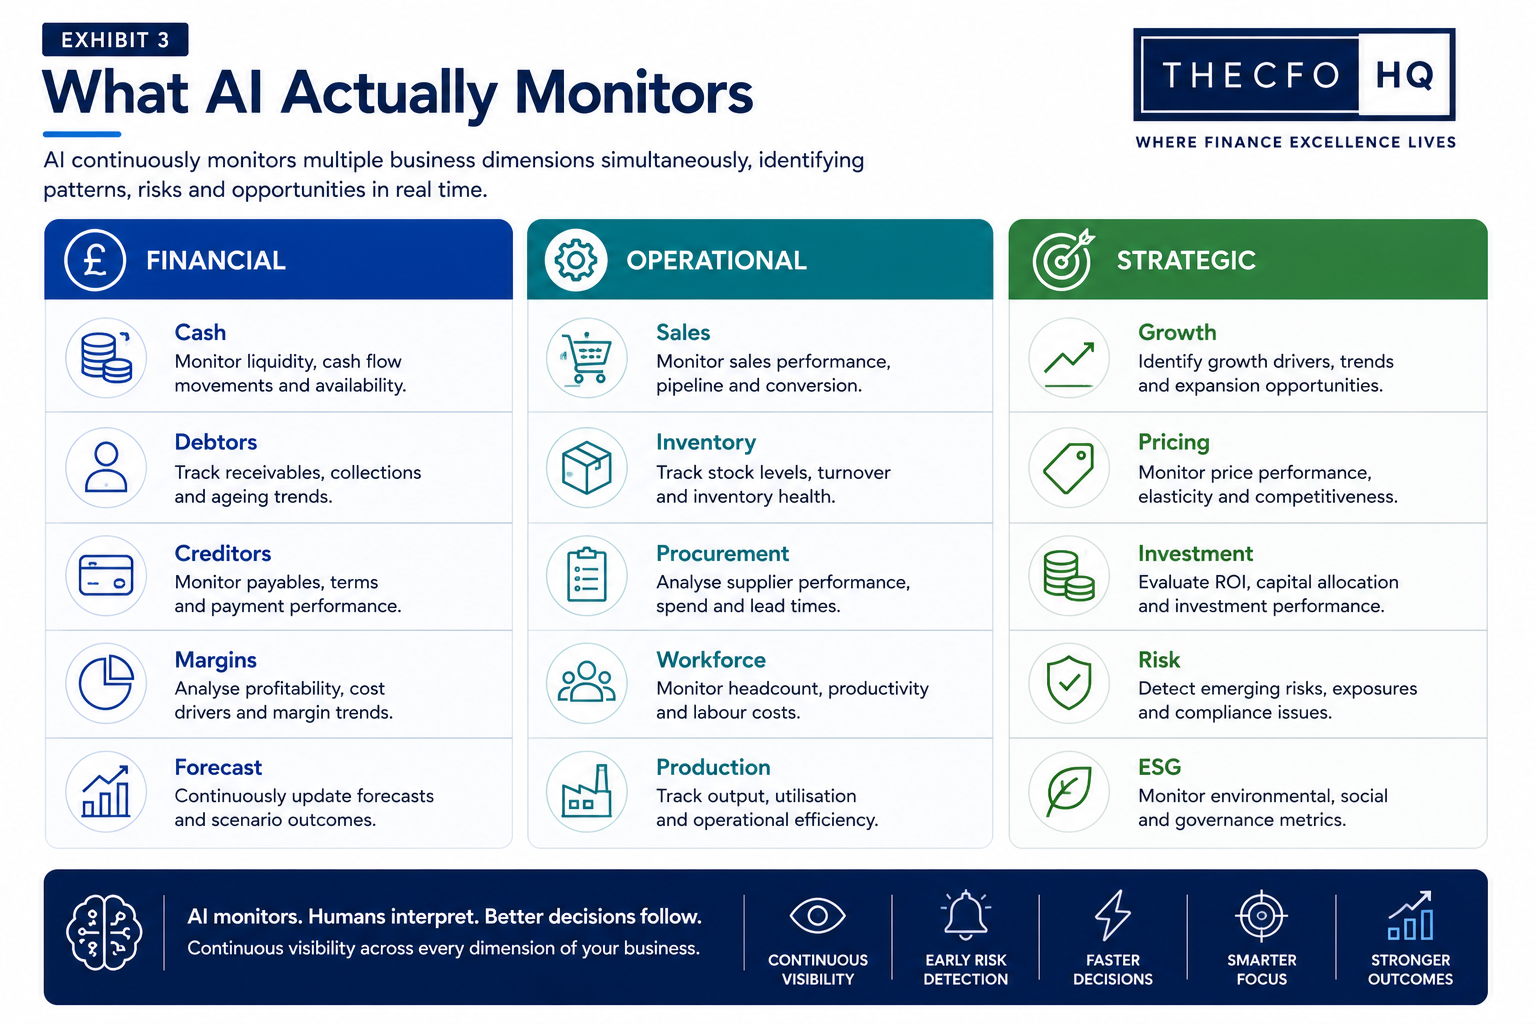
Monitor cash position, movements, runway, collections, payables and working-capital pressure points.
Track performance by product, customer, channel or business unit and identify margin movement earlier.
Refresh forecasts more frequently, compare scenarios and understand sensitivities before decisions are made.
Surface anomalies, threshold breaches, covenant headroom and other agreed financial or operational indicators.
Connect sales, inventory, procurement, workforce, production and project signals to financial outcomes.
Create a clearer, more consistent performance narrative for boards, lenders, investors and leadership teams.
Needs a simple view of cash, sales, margin and near-term priorities without building a large finance team.
Clarity without enterprise complexity
Needs one trusted performance narrative, earlier warning and clear choices across strategy and execution.
Decision confidence
Needs to reduce manual reporting, deepen analysis and focus the team on action, challenge and value creation.
More strategic capacity
Needs consistent visibility across cash, value-creation initiatives, risk, forecast and operating performance.
Sharper portfolio oversight
Needs scalable dashboards, disciplines and CFO support while systems, skills and processes mature.
A platform that grows with you
Instead of waiting for the next reporting cycle, the Dashboard helps the leadership team identify the signal, test the implications and prioritise action.
The value comes from improving the quality, frequency and commercial relevance of finance insight—not from technology in isolation.
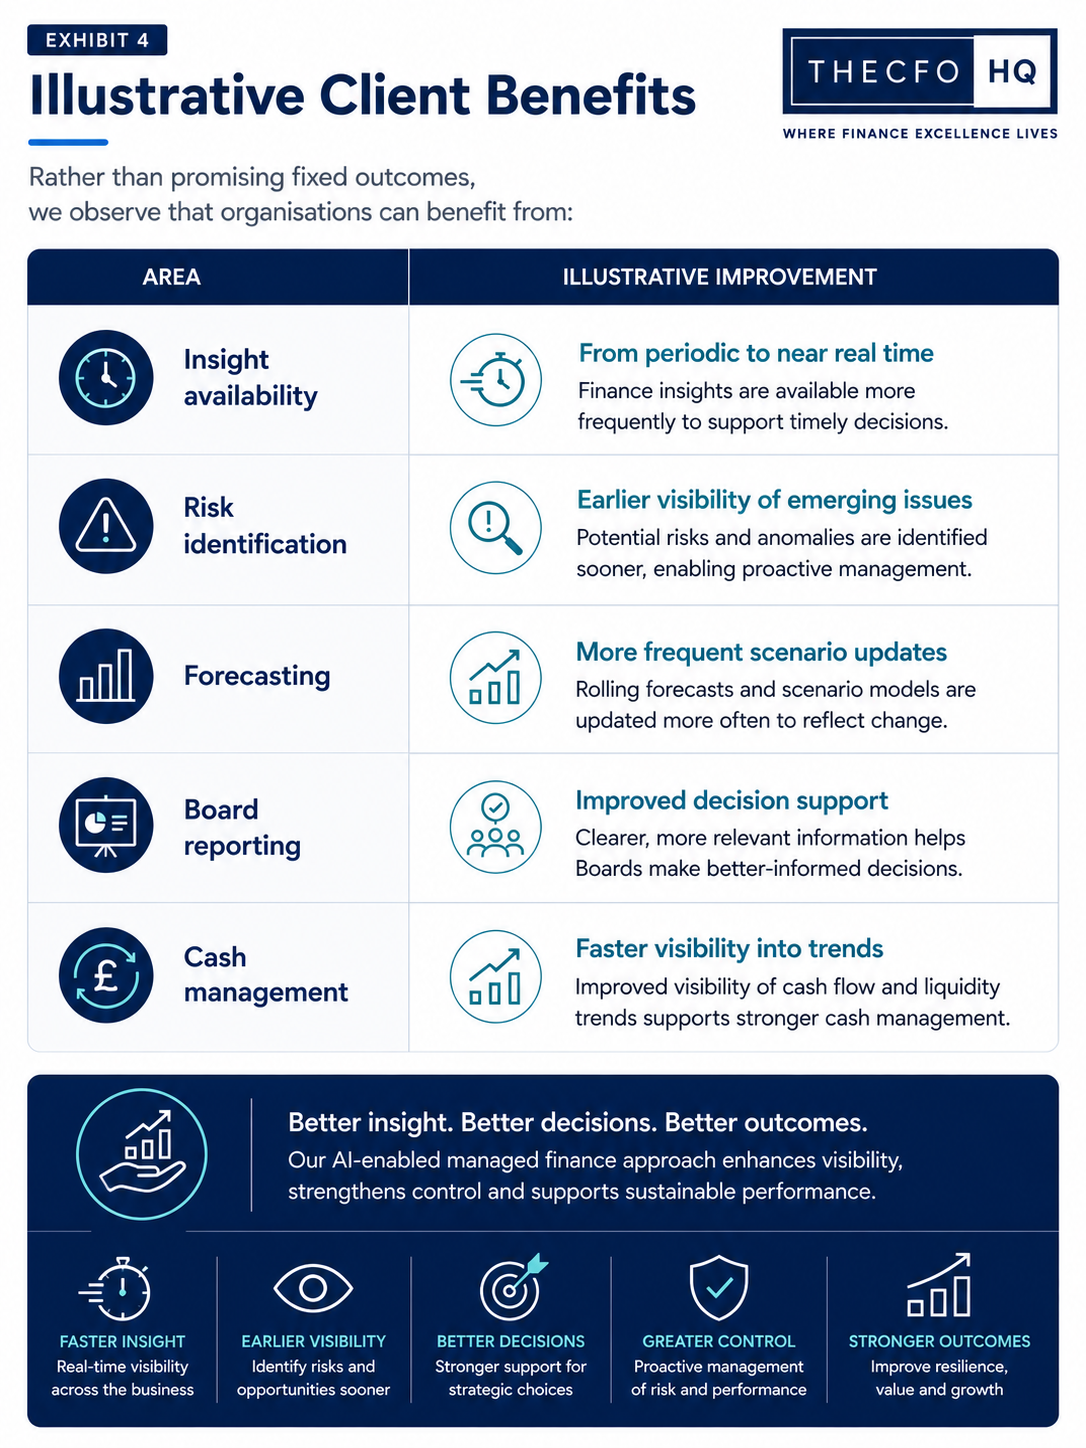
Benefits are illustrative and vary by organisation, data quality, system landscape, sector, operating maturity, agreed scope and management action. The Dashboard supports professional judgement; it does not replace management accountability.
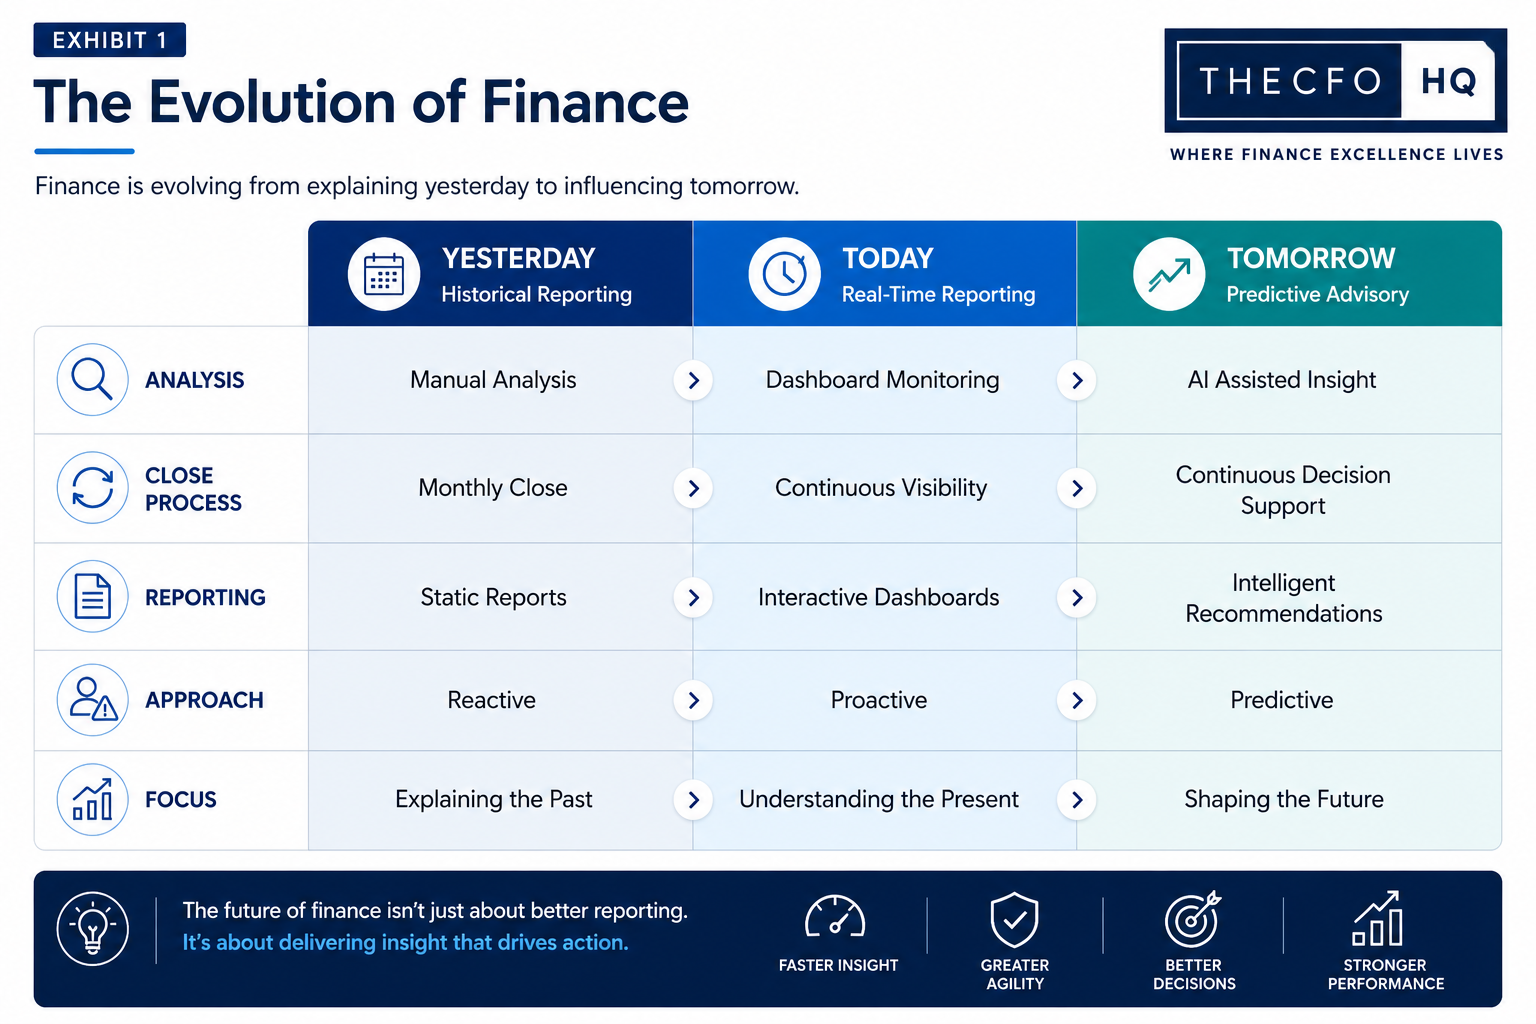
Open each exhibit for a concise visual explanation of the finance evolution, monitoring scope and potential client benefits.
Agree the business questions, priority users, critical KPIs and current reporting pain points.
Review available sources, data quality, access, ownership and the appropriate integration route.
Configure dashboards, thresholds, forecasts and management views around agreed priorities.
Introduce CFO review, governance, decision routines and a roadmap for expanding value.
No. The scope can begin with a concise set of cash, sales, margin and forecast views for a small or growing business, then expand as needs and data maturity develop.
No. It is designed as a decision and advisory layer that uses approved data from relevant source systems. Integration feasibility depends on the systems, data and agreed scope.
No. Automated monitoring can surface patterns and exceptions, but experienced finance professionals interpret the context and management retains decision accountability.
Typical areas include cash, debtors, creditors, revenue, margin, forecast, sales, inventory, procurement, workforce, production, projects and selected strategic or risk indicators.
Begin with a discovery session to define the decisions that matter, assess available data and identify a focused first release with clear ownership and success measures.
Explore how the Digital Dashboard and Real-Time Advisory model could strengthen visibility, decision support and performance across your organisation.